Vector data
Tree density in Utrecht
Understanding and applying Vector Data in ArcGIS Pro
Vector data, represented through points, lines, and polygons, is an important component of geospatial analysis. Points, which define specific locations, are essential for mapping and analyzing discrete features such as trees, buildings, or landmarks. Vector data is relevant, as it is know for its precision and versatility, enabling detailed spatial analysis and decision-making. ArcGIS Pro is a powerful tool for creating vector maps, allowing users to import, visualize, and analyze vector data through an intuitive interface. With ArcGIS Pro, users can perform various geospatial operations, customize maps, and share their results with a broader audience.
Using Open Vector Data to Map the tree density in Utrecht
For my project, I downloaded open vector data of trees in Utrecht to create a detailed map. This experience taught me the importance of selecting the correct layer for each operation, as the analysis applies specifically to the chosen layer. Learning to navigate ArcGIS Pro was a significant part of this process, involving numerous data operations and conversions. This project not only enhanced my technical skills to work with ArcGIS Pro, but also provided valuable insights into the practical applications of vector data in urban planning. Through this project, I gained a better understanding of how to use ArcGIS tools to manipulate and analyze geospatial data effectively.
Kernel Density Map of Oak trees in Utrecht
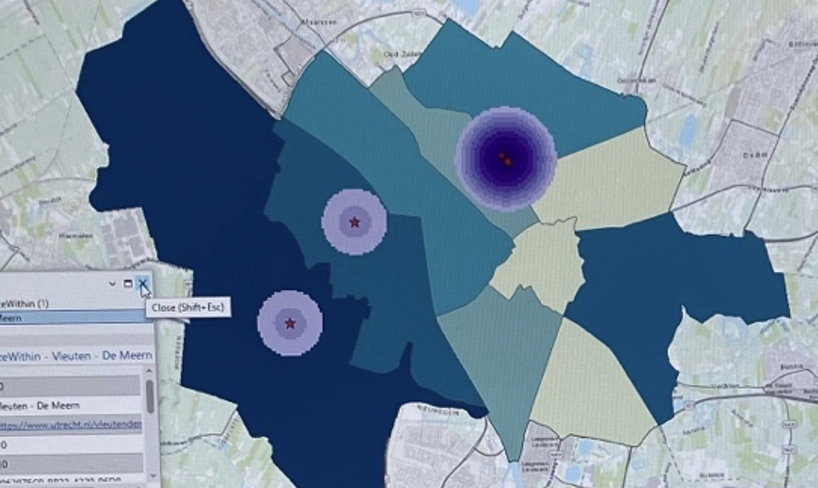
Although I am not entirely satisfied with the final result, I wanted to include this map as it demonstrates the great usability of a kernel map. This was my first project using ArcGIS Pro, and unfortunately, the final maps were not saved, leaving me with only this low-quality picture. I will explain the good potential of a kernel map. A kernel map, also known as a kernel density map, is a type of heat map used to visualize the density of spatial features across a given area. By applying a kernel density estimation, this map highlights areas with a high concentration of features, such as trees, by creating a smooth, continuous surface. In my project, the kernel map illustrates the density of 'Eiken' (oak) trees in Utrecht. Since there are only four Oak trees in Utrecht, however, this kernel density map is not continuous and smooth. The map does show where these trees are most densely clustered. In general, a kernel density map gives insights into distribution patterns and helps to identify regions with significant high concentrations. Such visualizations can be important for urban forestry management, environmental planning, and biodiversity studies, in this case offering a view of (oak) tree density across the city.